Working with AER#
Address-event representations (AER) is one of many ways to represent events. In AER, a single event is represented by a tuple, describing its “coordinates” in spacetime. For a 2-dimensional camera, that can be
If we have many events (and we do!), then we observe a very long list of these AER tuples, like this in csv format:
0,120,3
0,271,128
...
Note that this is very different from how we are normally working with data (in dense tensors). So, first, we should convert these coordinates to tensors.
Task 0: Imports#
import numpy as np
import torch
from urllib.request import urlretrieve
import matplotlib.pyplot as plt
import tqdm
---------------------------------------------------------------------------
ModuleNotFoundError                       Traceback (most recent call last)
Cell In[1], line 5
      3 from urllib.request import urlretrieve
      4 import matplotlib.pyplot as plt
----> 5 import tqdm

ModuleNotFoundError: No module named 'tqdm'
Task 1: Working with coordinates#
We prepared a simple sample in a CSV file. It’s in the file sample.csv. Load it using numpy.loadtxt or similar. Can you make sense of it? What does it show? Can you name each column?
filename, _ = urlretrieve("https://raw.githubusercontent.com/ncskth/phd-course/main/book/module3/sample.csv")
data = np.loadtxt(filename, delimiter=",")
# ...
Task 2: Working with event files#
The CSV format is poorly suited for describing AER data. For that, we have more sophisticated AER representations, such as AEDAT, EVT, RAW, and several others. Fortunately, we have a piece of software that can help us out: AEStream
Before getting started, install AEStream below:
!pip install aestream -q
Task 2.1: Loading up all the events#
Import it and use the FileInput to .load() another sample, this time using the EVT format in a file named sample.dat. Can you figure out what aestream loaded for us?
import aestream
filename_dat, _ = urlretrieve("https://raw.githubusercontent.com/ncskth/phd-course/main/book/module3/sample.dat", filename="sample.dat")
events = aestream.FileInput(filename_dat, (640, 480)).load()
# ...
Hint: Note that the events are now four dimensions. Why do you think that is?
Task 2.2: Working with frames#
The problem with the AER format is that it’s pretty unhandy when we work with neural networks on CPUs and GPUs. Here, we will need tensors of a fixed shape that we can pass into our networks.
The code below creates frames for you in a very manual and tedious way.
Can you tell what the code is doing?
Why is it slow? And what could you do to make it faster?
# We only look at the first 10^6 events
events_subset = events[:1000000]
# The interval between frames
time_interval = 1000

# Start generating a number of frames
frames = []
index = 0
current_frame = torch.zeros(2, 640, 480)
for (t, x, y, p) in tqdm.tqdm(events_subset):
    if t // time_interval > index:
        frames.append(current_frame.clone())
        current_frame.fill_(0)
        index += 1
    current_frame[p, x, y] = 1
100%|██████████████████████████████████████████████████████████| 539481/539481 [00:08<00:00, 65227.16it/s]
Task 2.3: Plot the frames#
Let’s inspect the frames that came out of this. Is it reasonable to use this as input data to the task below: a convolutional edge detector? Why/why not?
# plt.imshow(...)
2.4: Rework the time_interval above to produce more reasonable frames#
Spoiler: the frames above are weird.
Probably because the time_interval setting above is wrong.
Fix it! Then re-run your frames and inspect them to see if they make more sense.
Task 3: Convolutional edge detector#
In this task, we’ll create a convolutional edge detector. It will work very similar to a regular convolutional neural network in the sense that we “simply” take a kernel that looks for an elementary (edge) pattern and then apply it to the incoming frames. Easy. And it works well with events, too.
Here’s a video that shows you a an example from the AEStream docs where we detect horizontal and vertical edges. Use the code for inspiration.
Task 3.1 Define a kernel#
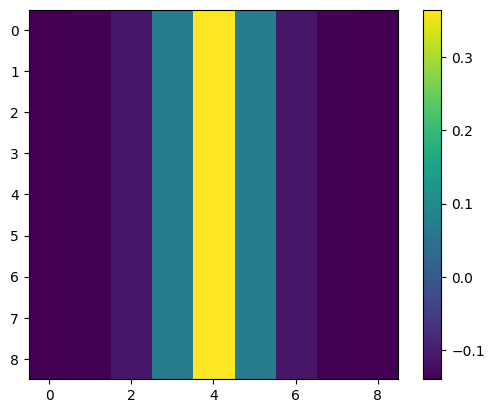
The first step is to define a kernel that can detect a certain type of edge. Here’s one example you can use if you’d like. Can you figure out what this code is doing?
kernel_size = 9
gaussian = torch.sigmoid(torch.linspace(-10, 10, kernel_size + 1))
kernel = (gaussian.diff() - 0.14).repeat(kernel_size, 1)
plt.imshow(kernel)
plt.colorbar()
<matplotlib.colorbar.Colorbar at 0x746a3b626da0>
Task 3.2#
Use your kernel in a convolutional layer.
net = ...
Task 3.3#
Apply your convolutional network to the frames above. Do you see what you expect?
Try tweaking your kernels above to see if you can get more meaningful results.
# output = []
# for frame in frames:
#   output.append(net(frame))
#    ...